Safety of PET/CT and Tomography in Cancer Diagnosis: How to Calculate Radiation Dose and Reduce Risk
The content shared here is a summary of the article, for the full article: visit health physics
The modern medical world is pushing the envelope with technologies that are radically changing diseases, especially the process of cancer diagnosis . At the pinnacle of this advancement are Positron Emission Tomography/Computed Tomography (PET/CT) scans , which combine functional information at the cellular level with anatomical detail.
This powerful cancer diagnostic tool offers doctors vital information that shows where the tumor is and how active it is. However, this process inevitably brings with it radiation exposure. Transforming this invisible risk into concrete data is one of the most important ethical responsibilities of scientists.
This responsibility entails precisely measuring the radiation to which the patient is exposed using sophisticated PET/CT efficient dose calculation methods.
Focus of the Study: This comprehensive analysis is based on the findings of a scientific study conducted on the data of 305 oncology patients at Yeditepe University Nuclear Medicine Department. The aim is to reveal the critical impact of different software used on dose predictions.
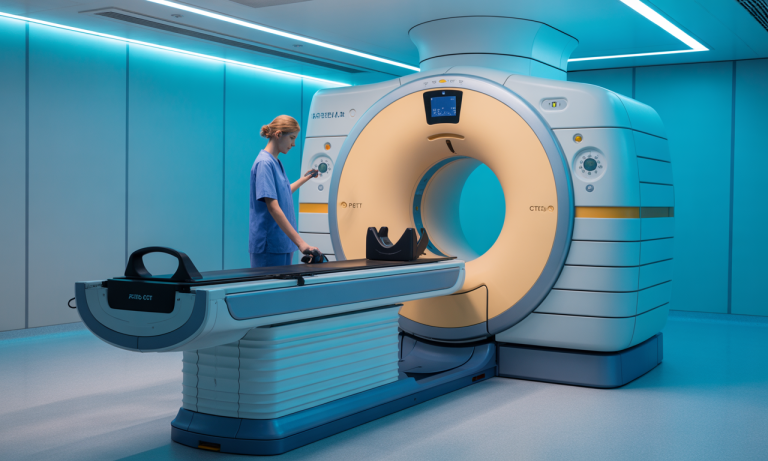
The Essential Tool in Cancer Diagnosis: What is PET/CT?
When a patient comes to the hospital for a cancer diagnosis or treatment follow-up, doctors want to know not only the size of the tumor, but also how “active” that tumor is. This is where PET/CT makes a difference. This scan combines two different imaging modalities into a single high-resolution image:
- PET (Positron Emission Tomography): Provides Functional Information .
- Thanks to the radiopharmaceutical injected into the patient, the metabolic activities of the body are monitored.
- Tracers like 18F-FDG track cancer cells that consume high amounts of sugar, showing how fast the tumor is growing as bright spots.
- CT (Computed Tomography): Provides Anatomical Information .
- CT, also known as tomography, creates detailed structural mapping of organs, bones, and tissues using X-rays.
Combining these two images provides doctors with a comprehensive map that shows both the exact location (Tomography) and cellular activity (PET) of the cancerous area.
The Central Concept of Radiation Safety: Why Is Effective Dose Measured?
Since medical diagnostic procedures increase the total radiation exposure of individuals, the issue of radiation safety has become central to PET/CT applications. The Effective Dose is the unit of measurement of this risk.
Effective dose does much more than just measure the energy of radiation entering the body:
- It takes into account the type of radiation: It calculates the internal radiation from radiopharmaceuticals and the external X-ray radiation from Tomography separately.
- Calculates Organ Sensitivity: It determines the risk of radiation developing biological damage and cancer on each organ.
This risk is calculated by tissue weight factors determined by the International Commission on Radiation Protection (ICRP). For example, tissues like the bone marrow or lungs have a higher weight factor because they have a higher risk of cancer compared to other tissues.
Basic Calculation Formula: This scientific study collects PET and CT doses to calculate the total effective dose: EDTtotal=EDPET+EDCT
Mapping Internal Radiation: Critical Organ Doses
As soon as the radiopharmaceutical is injected into the patient, it begins a journey through the body. This journey is followed by the biokinetic model, which shows in which organs the substance accumulates. The study compared the doses of two main cancer diagnosis tracers in critical organs:
- 18F-FDG (Glucose Tracer):
- It targets the body’s high-energy-consuming (metabolically active) tissues.
- Organs Receiving the Highest Dose: The heart wall and the bladder wall. (Ex: Heart wall 0.067 mGy/MBq in women)
- 68Ga-PSMA (Prostate Cancer Tracer):
- It is designed to target prostate cancer diagnosis cells and is basically excreted through the kidneys.
- The Most Critical Organ: Kidneys. It received the highest absorbed dose (0.184 mGy/MBq).
This detailed data shows that each drug poses different risks to different organs and how drug-specific the effective dose calculation process should be.
Virtual Human Models: The Difference Between OLINDA and IDAC Software
Specialized software using the MIRD methodology is required to calculate the radiation dose accurately. These software use virtual human models, also known as phantoms , to calculate the transfer of radiation from one organ to another.
| Software Name | Phantom Type (Virtual Human Model) | The Critical Difference | Result Trend |
| OLINDA/EXM | Mathematical (Simplified Geometry) Phantom | Organs are represented by simple geometric shapes. | He gave the highest dose estimate. |
| IDAC-Dose 2.1 | Voxel Phantom (3D Realistic Model) | It uses 3D modeling based on Tomography (CT) data from real patients. | He gave the lowest and most up-to-date dose estimate. |
What is Voxel Phantom? It takes its name from “voxel,” which means “volume pixel.” These 3D models represent the shape and position of organs more anatomically accurately compared to older simplified models. This modern approach has made calculations more realistic.
Calculation Battlefield: Striking Differences in Dose Estimates
Unfortunately, software that predicts a patient’s radiation risk does not always give the same result. The most important scientific finding of the study is that there are statistically significant differences (P<0.001) in the effective dose calculation results according to the computer program used and the scientific references (ICRP) on which it is based. These differences show that old forecasting methods do not accurately reflect the current risk level.
PET Effective Dose for 18F-FDG Protocol: 9.96 mSv or 6.28 mSv?
In scans with 18F-FDG, the widely used cancer diagnosis tracker, the distinction between PET effective dose calculation results is truly remarkable:
- Legacy Approach (OLINDA/EXM – ICRP 60): Using mathematical phantoms (simplified virtual human model), this software gave the highest estimate, calculating the dose as 9.96 mSv.
- Current Approach (IDAC-Dose 2.1 – ICRP 103): This current software, which uses realistic voxel phantoms (3D virtual human model), estimated the dose as 6.28 mSv and gave the lowest and most accurate value .
Why is there a big difference?
This critical 3.68 mSv difference between the highest estimate and the lowest estimate is not due to an error but to the advancement of science. The new software uses two key updates:
- Tissue Weight Factors: ICRP 103’s updated tissue weight factors assess the risk of organs to radiation more realistically.
- Voxel Phantom Geometry: Voxel phantom geometry, based on Tomography data from real patients, calculates energy transfer more precisely.
Critical Takeaway: This concretely proves that older software tends to overestimate a patient’s cancer risk for the same amount of radiation.
68Comparison of PET Effective Dose for Ga-PSMA Protocol
This significant downward trend has continued in the 68Ga-PSMA protocol, the tracer used for prostate cancer diagnosis:
- Highest Estimate (OLINDA/EXM – ICRP 60): Calculated as 3.65 mSv .
- Lowest Estimate (IDAC-Dose 2.1 – ICRP 103): Provided the most recent and lowest estimate with 1.83±0.27 mSv .
These findings prove that the results of effective dose calculation vary greatly depending on the underlying biokinetic model (distribution of the radioactive drug in the body), phantom type (virtual human model) and the timeliness of the ICRP references in the software used. Based on older models in both protocols, OLINDA/EXM has consistently yielded the highest dose estimates.
The Primary Safety Focus: Tomography (CT) and Risk Mitigation
Perhaps the most important finding of the study in terms of radiation safety in cancer diagnosisis that most of the total radiation exposed to patients comes from the Tomography (CT) component.
| Protocol | Contribution of Tomography (CT) Dose to Total Dose | Average CT Effective Dose |
| 18F-FDG PET/CT | About 75.6% | 19.05±5.89 mSv |
| 68Ga-PSMA PET/CT | Approximately 92% | 20.17±5.87 mSv |
Key Takeaway: In 68Ga-PSMA scans, almost all (92%) of the total dose comes from a Tomography (CT) scan. This suggests that radiation safety strategies should largely focus on optimizing CT protocols.
Organs Most Affected by CT Exposure (Sequential):
- Lungs
- Stomach
- Colon
- Red Bone Marrow
- Gonates
Clinical Safety Principle: Clinicians should always apply the ALARA (As Low As Reasonably Achievable) principle to reduce radiation exposure. This necessitates the use of low-dose CT techniques.
Conclusion: Scientific Efficiency and Ethical Responsibility
This study proved that the effective dose calculation tools used in PET/CT applications have differences in their ability to accurately predict the risk to which patients are exposed during cancer diagnosis.
- The most up-to-date software, IDAC-Dose 2.1, provides the lowest and most realistic PET effective dose estimates.
- The fact that the majority of the total radiation dose comes from the Tomography (CT) component confirms that continuous optimization of CT protocols is the most critical step in terms of radiation safety .
“PET/CT effective dose calculation” is not only a complex scientific value, but also a commitment to patient safety in the cancer diagnosis process of modern medicine.
So, do you think artificial intelligence and machine learning will be able to carry future efficient dose calculation systems to a point where they can make one hundred percent accurate dose predictions using individualized biokinetic models specific to each patient’s unique biology? This scientific and ethical journey will be the next exciting stage in the quest that combines technology and human health.